Methane images from O'Brien and Cao, JQRST 75 (2002) 323-350

Fig 10. Methane absorption coefficients for the 750-940 nm region derived from ILS spectra of
methane at 296 K.
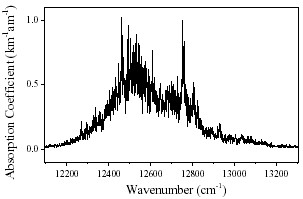

Fig 6. Methane absorption coefficients for the 790 nm band derived from ILS spectra of methane at
296 K. Left panel averaged per cm-1; right panel averaged per angstrom.
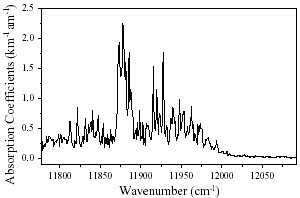

Fig 7. Methane absorption coefficients for the 840 nm band derived from ILS spectra of methane at
296 K. Left panel averaged per cm-1; right panel averaged per angstrom.

Fig 8. Methane absorption coefficients for the 861 nm band derived from ILS spectra of methane at
296 K. Left panel averaged per cm-1; right panel averaged per angstrom.

Fig 9. Methane absorption coefficients for the 889 nm band derived from ILS spectra of methane at
296 K. Left panel averaged per cm-1; right panel averaged per angstrom.